- AHD Apps
- Market Analysis
Market Analysis
A picture really can be worth a thousand words. The Market Analysis App is a tool that enables you to create interpretive maps based on Medicare patient origin data. You can display statistics for a single hospital or for a group of hospitals. You can also select a geographic area and display statistics for hospitals with patients originating from the area. Statistics are color coded by ZIP code and also listed in supporting tables.
This powerful tool helps to readily identify market shares, admission patterns, and other important perspectives based on the most current Medicare patient origin data available. American Community Survey data from the United States Census Bureau is also included by zip code for demographic analysis. The app's flexibility and responsiveness makes patient origin data even more valuable and actionable.
Hospital views
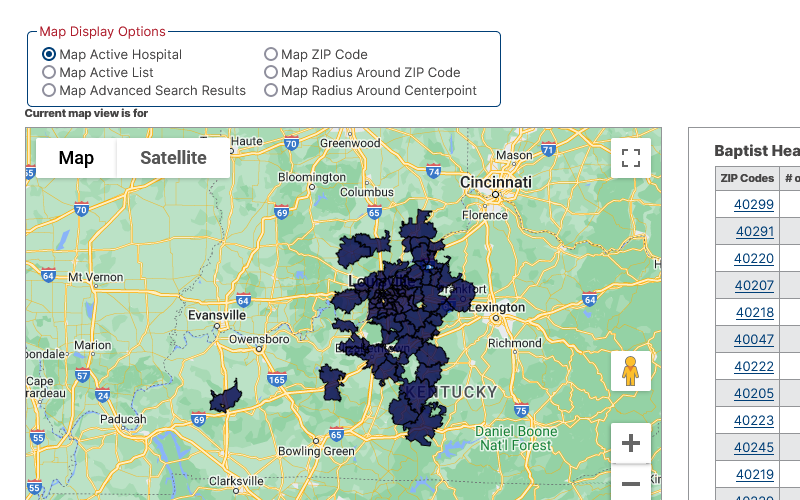
- Map Active Hospital
- Displays the ZIP codes served by the Active Hospital you have chosen. ZIP codes are shown in gradations of color that correspond to the number of patients and a table appears below the map detailing key operating statistics for the hospital. You can change to a different hospital by selecting a new Active Hospitala.
- Map Active List
- Displays the ZIP codes served by the hospitals in your Active List. ZIP codes are color coded to correspond to the hospitals in your list and a table appears below the map identifying the hospitals and showing their key operating statistics. You can modify the hospitals shown by modifying your Active List.
- Map Advanced Search Results
- Displays the ZIP codes served by the hospitals appearing in your most recent Advanced Search results. This is a great way to select hospitals based on criteria such as hospital type, bed size, etc. ZIP codes are color coded to correspond to the hospitals in the list and a table appears below the map identifying the hospitals and showing their key operating statistics. You can modify the hospitals shown by performing a new Advanced Search. You can also name and save the list for future analysis.
Geographic views
- Map ZIP Code
- Displays all hospitals serving the ZIP code(s) specified. The map will color the ZIP according to the hospital with the most patients and the table below the map will detail key operating statistics for all of the hospitals.
- Map Radius Around ZIP Code
- Displays all hospitals within a specified radius surrounding the ZIP code specified. The map will color included ZIP codes according to the hospital with the most patients and the table below the map will identify the hospitals and detail their key operating statistics.
- Map Radius Around Centerpoint
- Displays the zip code at the center of the map as well as surrounding zip codes within the radius specified. The map will color individual ZIP codes according to the hospital with the most patients and the table below the map will identify the hospitals and detail their key operating statistics.