- AHD Apps
- MS-DRG Coding Indicators
MS-DRG Coding Indicators
Complete and accurate medical record documentation and coding has always been important under prospective payment. With the introduction of MS-DRGs in FY 2008, the importance became even more critical. Today's MS-DRGs more accurately reflect levels of patient severity and make it even more important to identify all complications in.
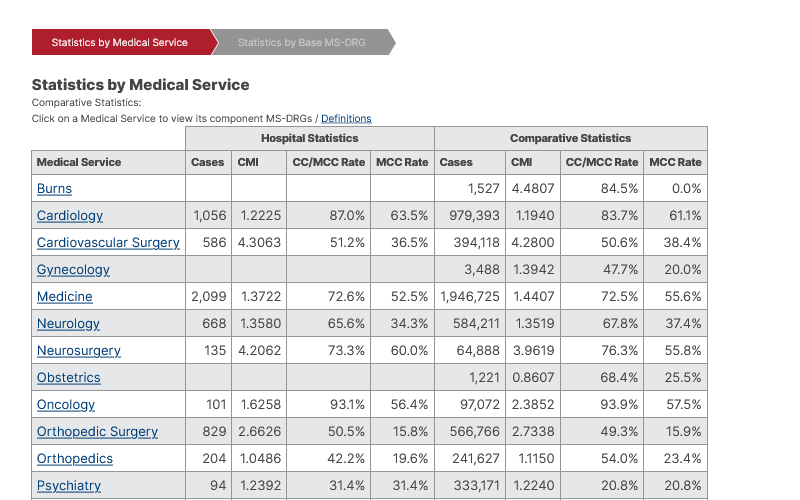
This app provides a set of key measurements that help management compare hospital coding practices with benchmarking data to help measure and monitor performance. There are two sections of reporting. The first section contains the number of cases, a case mix index, and two complication rates for each medical service. Reporting by medical service is important because there are documentation and coding issues that can be problematic in certain medical specialties. Focused reporting makes it easier to identify problems and monitor improvement. For example, documentation issues in the treatment of pneumonia are obscured in overall statistics but become more evident in statistics for just the Pulmonology medical service. The report does, however, provide overall averages for the hospital.
The second level of reporting provides the same statistics by base MS-DRG. By clicking on a medical service in the first section, a list of all base MS-DRGs making up the service are reported. A "base MS-DRG" combines individual MS-DRGs that differ only in the presence of complications. The following table illustrates how they are combined:
| DRG | BASE MS-DRG Description | MS-DRG | MS-DRG Description |
|---|---|---|---|
| 127 | Heart failure & shock | 291 | Heart failure & shock w MCC |
| 292 | Heart failure & shock w CC | ||
| 293 | Heart failure & shock w/o CC/MCC | ||
| 128 | Deep vein thrombophlebitis | 294 | Deep vein thrombophlebitis w CC/MCC |
| 295 | Deep vein thrombophlebitis w/o CC/MCC | ||
| 132 | Atherosclerosis w CC | 302 | Atherosclerosis w MCC |
| 133 | Atherosclerosis w/o CC | 303 | Atherosclerosis w/o MCC |
| 140 | Angina pectoris | 311 | Angina pectoris |
A case-mix index is computed for each base MS-DRG to determine its average severity. Benchmarking this CMI is helpful in determining whether a base MS-DRG's complication rates are higher or lower than expected.
Capture rates are used to help compare the incidence of patients with complications as a percentage of total patients. If a hospital rate is lower it may indicate lost revenue. If a hospital rate is higher it may indicate aggressive documentation or coding. There are two types of complications in MS-DRGs: regular complications and major complications. Major complications are typically infrequent and have higher relative weight. Two complication rates are reported. A CC/MCC Rate includes both types of complications as a percentage of total. A MCC Rate includes only major complications as a percentage of total. The following table shows how these rates are determined:
| MS-DRG | MS-DRG/Base Description | Number Discharges | CC/ MCC Rate | MCC Rate |
|---|---|---|---|---|
| 291 | Heart failure & shock w MCC | 156,437 | Y | Y |
| 292 | Heart failure & shock w CC | 148,366 | Y | N |
| 293 | Heart failure & shock w/o CC/MCC | 103,145 | N | N |
| Heart failure & shock | 74.7% | 38.3% | ||
| 294 | Deep vein thrombophlebitis w CC/MCC | 1,148 | Y | |
| 295 | Deep vein thrombophlebitis w/o CC/MCC | 707 | N | |
| Deep vein thrombophlebitis | 61.9% | |||
| 302 | Atherosclerosis w MCC | 6,273 | Y | Y |
| 303 | Atherosclerosis w/o MCC | 42,269 | N | N |
| Atherosclerosis | 12.9% | 12.9% | ||
| 311 | Angina pectoris | 13,389 |
The MS-DRG Coding Indicators app is a powerful tool for monitoring complete and accurate coding, identifying opportunities for improvement, and ensuring compliance.